Table Of Contents
Last year saw the biggest increase in the divorce rate for over a decade, largely due to the introduction of no-fault divorce.
There were 116,000 divorce applications in 2022, an increase of 7,800 compared with 2021.
Divorce-Online, one of the UK’s largest filers of divorce applications has undertaken research to find out where divorce is the most prevalent in the UK.
The company decided to do some data mining after seeing the UK have the largest increase in divorce applications for a decade.
Mark Keenan, a representative of the company, stated, “Traditionally, addictions to substances like drugs and alcohol, as well as behaviours like gambling and excessive social media use, have been identified as catalysts for the dissolution of relationships. However, the advent of the digital age has ushered in a new wave of addictive behaviours, such as excessive gaming, online shopping, virtual reality engagements, and an overreliance on digital devices, each presenting its own unique challenges to maintaining healthy relationships.””
So, where is the divorce capital in the UK?
Croydon claimed the unfortunate title of being the divorce capital of the UK when we looked at this data back in 2018.
Since then, a lot has happened, so we wanted to do some data crunching to see what’s changed.
With an adult population of around 8,000, the market town of Alfreton finds itself in the unfortunate position of being the #1 hotspot for divorce.
Here are the top 10 Towns and Cities with the highest rate of divorce in 2023:
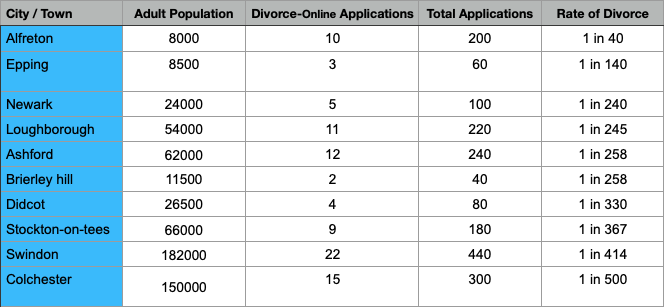
The top 10 towns and cities with high rates of divorce in 2023. Research by Divorce-Online.
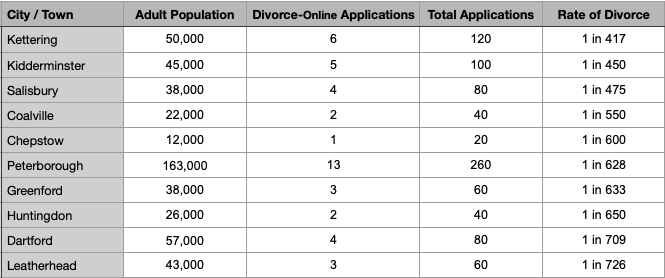
Following on from the top 10, here are the Towns and Cities that just missed out and placed position 11-20.
These locations also have higher rates of divorce compared with other areas of the UK
Methodology Overview for Analysis of UK Divorce Rates
Our internal database, representing approximately 5% of all divorce applications in England and Wales, served as the primary source for the initial dataset.
To estimate the total number of applications, we scaled our figures by a factor of 20 (dividing by our market share of 5% and then multiplying by 100).
The Office for National Statistics provided the population data against which the divorce rates were calculated.
The total number of divorce applications was determined by applying the extrapolation factor to our market share, providing an estimate of the overall figures.
This approach ensures an authoritative and comprehensive analysis of divorce rates across England and Wales.
What our research shows
Reviewing our research, it’s clear there are hotspots for divorce in the UK.
The Midlands, East of England, and South of England appear to be specific areas with higher divorce rates than the national average.
Northamptonshire, Leicestershire, Essex, and, Cambridgeshire are the counties that are represented the most in our data set when looking at the top 20 Towns and Cities.
Related Articles
-
Latest Divorce Statistics for England and Wales
-
1/5 Divorce petitions mention gambling as ground for divorce
-
Is Fortnite Becoming a Relationship Wrecker?
-
New research validates Facebook study by Divorce Onliine
-
Financial Consequences of Getting Divorced Later in Life
-
Facebook continues to cause more divorce heartache